Using the Degree Days chart
To see how the weather has changed over the course of one year, as well as between years, go to:
Results > Weather efficiency > Degree Days.
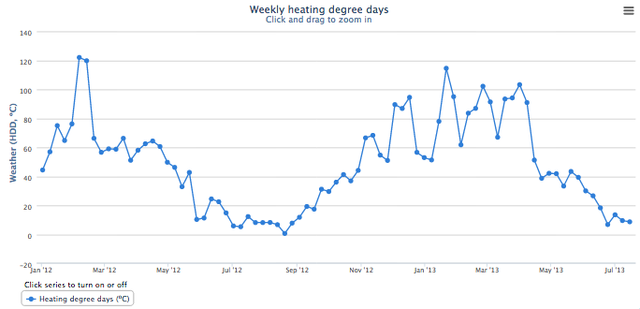
This graph shows how the demand for heating has varied with time. You can change the timescale by choosing a start and end date in the top right hand corner.
The “demand for heating” is the same as saying how cold it is. Therefore, the higher the value along the left side of the graph (the vertical axis), the colder the weather was.
What are Heating Degree Days?
Heating Degree Days (HDD) are a measure of how much you need to heat your building to keep it a comfortable temperature. The colder the outside temperature is, and the longer the period of time it is cold, the higher the HDD. To determine if this year was colder to last year, you can sum the total number of heating degree days in each other. The higher the number for a year the colder it was. You can also do this if you want to see how cold this month was compared to last year. The national annual number of heating degrees in the UK is 2021.