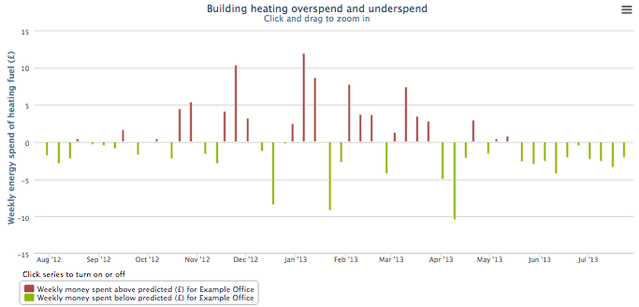
How is the energy over- or under-spend calculated
To view your energy over- or under-spend, go to: Results > Weather Efficiency > Overspend. Using the tariff information that you have entered into the building’s profile, and the energy consumption you have recorded with the meter readings, Pilio can calculate an estimate for your weekly energy bill. Using the same tariff information and Pilio’s expected energy consumption, your predicted energy bill can be calculated. The difference between the predicted bill and your actual bill is then your over- or under-spend. You have over-spent on your energy when your actual consumption is more than your predicted consumption, and you have under-spent when actual is less than predicted consumption.
The Overspend Chart shows the same information as the Control Chart but in different units – the Control Chart shows over- and under-use of energy in kWh, and the Overspend Chart shows it in pounds sterling. Pilio provides only an indication of your energy spend as the application is not aligned to your billing cycle, which might charge for the first X kWh at one rate and then the next Y kWh at another rate. However, the energy spend figures presented in Pilio are proportional to consumption and can help inform energy management decision-making on priorities and return on investment for taking energy efficiency measures.
Deep-Dive: Understanding Your Energy Overspend and Underspend in Energy Management Decision-Making
Understanding your energy overspend and underspend is crucial for informed energy management decision-making. It helps in setting priorities and evaluating the return on investment (ROI) for implementing energy efficiency measures.
Identifying Overspend and Underspend Using Pilio Software
Energy Overspend:
- Occurs when actual energy costs exceed the budgeted or expected amounts.
- Indicates areas where energy consumption is higher than necessary or where inefficiencies exist.
Energy Underspend:
- Occurs when actual energy costs are lower than the budgeted or expected amounts.
- Indicates areas where energy savings have been achieved or where further reductions are possible.
Understanding Your Overspend and Underspend Helps Inform Priorities
Focus on High-Impact Areas:
- Overspend Analysis: By identifying areas of overspending, you can prioritise improvements in high-consumption areas. For example, if heating costs are significantly higher than expected, this area becomes a priority for energy efficiency measures.
- Underspend Analysis: Understanding areas of underspend helps to identify successful strategies and best practices that can be applied to other areas. It also indicates where further reductions are possible without significant investment.
Resource Allocation:
- Resources can be allocated more effectively by focusing on areas with the highest potential for cost savings and efficiency improvements. Prioritising high-impact areas ensures that the most significant issues are addressed first, maximising the benefits of energy management efforts.
Evaluating Return on Investment (ROI)
Cost-Benefit Analysis:
- Overspend Areas: Investing in energy efficiency measures in areas of overspend can yield high returns. For instance, replacing an inefficient HVAC system in a building that consistently exceeds energy budgets can lead to substantial cost savings.
- Underspend Areas: In areas of underspend, the focus can be on maintaining efficiency while exploring low-cost or no-cost measures to further reduce consumption.
ROI Calculations:
- Calculate the expected savings from proposed energy efficiency measures and compare them to the initial investment. Understanding where overspend occurs allows for more accurate ROI calculations, as the baseline energy costs are higher.
- For example, if an area shows a consistent overspend of £1,000 annually, and an energy efficiency measure costs £2,000 to implement but saves £500 annually, the payback period is 4 years. This calculation helps in making informed investment decisions.
Long-Term Strategy Development
Benchmarking and Monitoring:
- Use data on overspend and underspend to establish benchmarks for energy performance. Regular monitoring against these benchmarks helps in tracking the effectiveness of implemented measures and adjusting strategies as needed.
Continuous Improvement:
- By continuously analysing energy spend data, you can identify new opportunities for savings and energy efficiency improvements. This ongoing process ensures that energy management practices evolve with changing technologies and operational needs.
Practical Example
Scenario:
A manufacturing facility has an annual energy budget of £100,000 but spends £120,000 due to high electricity usage in production processes.
Steps to Address Overspend:
- Identify High-Consumption Areas:
- A detailed energy audit reveals the energy performance of outdated machinery and poor lighting contribute to the overspend.
- Prioritise Improvements:
- Focus on replacing old machinery and upgrading to energy-efficient lighting.
- Calculate ROI:
- New machinery costs £50,000 but reduces annual energy costs by £15,000.
- Upgrading lighting costs £10,000 with annual savings of £5,000.
- Total investment: £60,000; Total annual savings: £20,000.
- Payback period: 3 years.
- Implement Measures:
- Invest in new machinery and lighting upgrades.
- Monitor and Adjust:
- Track energy usage post-implementation to ensure energy savings are realised.
- Adjust strategies based on performance data.
Summary
Understanding your energy overspend and underspend is essential for effective energy management and understanding energy performance. It enables you to prioritise high-impact areas, allocate resources efficiently, and make informed decisions on energy efficiency investments. By doing so, you can optimise energy usage, achieve significant cost savings, and improve the overall performance of your energy management strategy.
The following FAQ’s may help you further understand your performance and results with Pilio energy software:
- Predicting your energy use
- Comparing energy efficiency, cold winter versus mild winter
- What is the A-G energy rating?
- Heating Degree Days (HDD) and the Weather
- Understanding heating consumption versus non-heating consumption
- About the accuracy of results
- What is an energy baseload?
- How to see the impact of energy-saving actions (CUSUM chart)
- Interpreting building efficiency