Comparing energy efficiency, cold winter versus mild winter
Pilio’s cloud energy software provides performance analysis, lets you see normalised energy consumption, and weekly energy consumption and presents deviations in energy use.
Your building will use more energy for heating during a cold winter than it will during a mild winter. So how do you tell if a severe increase in energy consumption is due to the weather, or because your building is not being as energy efficient as it could be? There are three charts you can view in "Performance" that will help you make a determination.
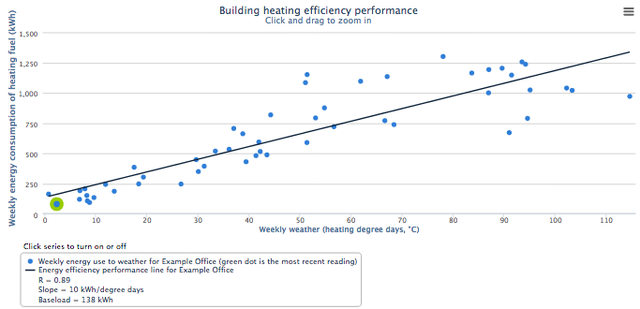
First, go to Performance > Heating > Performance. There you can see how your building’s weekly energy consumption compares to your current trend – the orange performance line. If it is a very cold week, then the Heating Degree Day value will be large (see Heating Degree Days and the Weather), and so the predicted energy use is greater. The closer the blue dots (which represent your actual data consumption) lie to the performance line, the more efficiently you are heating your building.
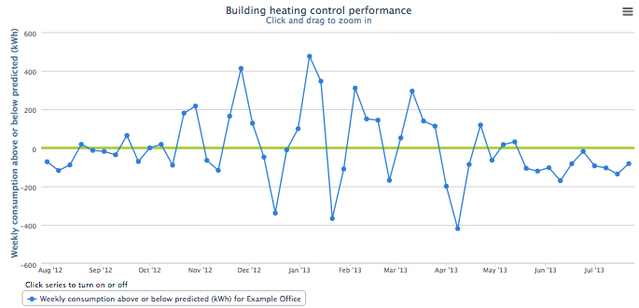
Second, you can go to Performance > Heating > Control. This chart shows you week-by-week how much energy you have over- or under-used compared to your expected use. If the blue line is above the green zero line then you have used more energy than expected, if it is below the zero line then you have saved energy. It is normal for a building’s energy consumption to oscillate above and below the horizontal green line – as long as these oscillations aren’t too large. If you are constantly using more energy than expected (blue dots always lie above the green line), then this could be a sign that there is a problem with your HVAC system.
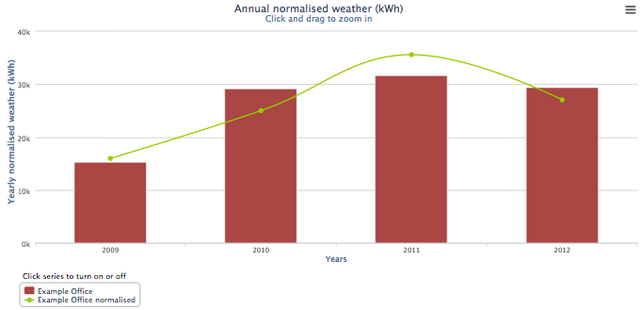
Lastly, you can go to Performance > Heating > Normalised. This chart shows you how your total energy consumption for each year compares to the weather. The green bars indicate your actual energy consumption, and the red lines indicate the energy you were expected to use given the weather during that year. If the green bars are lower than the red line for a particular year then you have saved energy, if they are above, then you have over-used energy.
Deep-Dive: Why the weather is crucial to understanding how your building's energy consumption
Understanding how your building's energy consumption varies between cold and mild winters is crucial for effective energy monitoring and management. By analysing these variations, you can determine if an increase in energy use is due to weather conditions or inefficiencies in your building's systems. Utilising cloud energy software can provide valuable insights into this aspect of energy management.
Importance for Energy Monitoring and Management
Energy Efficiency Rating: Understanding the relationship between your building’s energy consumption and weather conditions is vital for maintaining a high energy efficiency rating. By using Pilio’s cloud energy software to monitor performance, you can ensure that your building operates efficiently regardless of external temperatures.
Energy Savings: Identifying whether increased energy consumption is due to weather or inefficiencies enables you to implement targeted energy-saving measures. This can include optimising HVAC system operations, enhancing insulation, or adjusting energy usage patterns during different seasons.
Energy Management: Effective energy management relies on accurate data and analysis. By comparing energy use during cold and mild winters, you can make informed decisions to improve your building’s overall energy performance, reduce energy spend, and enhance sustainability efforts.
Conclusion
Comparing energy efficiency during different weather conditions using cloud energy software is essential for robust energy management. It helps in identifying inefficiencies, optimising energy use, and implementing effective energy-saving strategies. This comprehensive approach ensures that your building maintains high energy performance and efficiency, ultimately leading to reduced energy consumption and costs.
The following FAQ’s may help you further understand your performance and results with Pilio’s cloud energy software:
- How is the energy over- or under-spend calculated
- What is the A-G energy rating?
- Heating Degree Days (HDD) and the Weather
- Understanding heating consumption versus non-heating consumption
- About the accuracy of results
- Predicting your energy use
- What does 'carbon equivalent (CO2e)' mean?
- Exporting charts and tables
- What is a energy baseload?
- About Pilio weather data
- Historic degree day data
- How to see the impact of energy-saving actions (CUSUM chart)
- Why is it important to look at energy use in relation to the weather
- Weather corrected energy consumption in context
- Gas kWh: how do we calculate it?
- Interpreting building efficiency
- Using the Degree Days chart
- What carbon emission conversion factor is used to calculate the emissions from energy consumption?